EKG TIME! (For basic understanding)
Ok so for many the EKG is a weird and wonderful map of squiggles, but actually each little squiggle is very important in translating the conduction of the heart. From your A&P course you should know that the normal conduction of the heart starts in the SA node in the Right Atrium, it travels to the AV node in the wall of the right atrium (middle of the heart), then through the Bundle of His/Left & Right Bundle Branches and down through the Purkinje fibers. The EKG is basically a map of that scenario. Imagine that you are in a car in San Antonio (SA node), you need to drive to Aventura (AV node), then you go through the spaghetti junction (Bundle of His) while heading to Pittsburg (Purkinje fibers) – if you were to use Google maps, you would have the route highlighted out on the roads you have to take, right? Well that is basically what an EKG is! It is the highlighted route the conduction took through the heart.

I hope that has given you a little clarity on those squiggly lines, haha!
Now what does the map tell us?

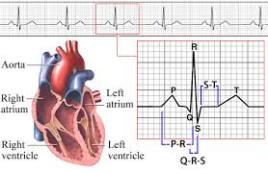
As you can see we use letters to signify different areas of the squiggle. You can see that P is a little bump at the beginning. This is showing us that the atria of the heart are depolarizing (another fancy word for compress or pump). The atria is pushing the blood into the ventricles. P shows that the car has left the SA node in the Right Atrium and is traveling to the AV node in the middle of the heart. From P to Q (called PR complex), the car then leaves the AV node and travels down through the Bundle of His. One the car travels out from the Bundle of His down the Bundle Branches, through the Purkinje fibers and the rest of the heart so a QRS complex occurs. The QRS shows that the ventricles have received all the blood from the atria and pumps it back out to lungs (right V) and aorta (left V). And with that you have just witnessed a heartbeat.
Well what about the leftover squiggles…
So between the S and the T (called the ST segment), we see the heart recovering from the heartbeat, otherwise known as Ventricular REpolarization. Think about clenching your fist really hard and then relaxing, that is in essence what the heart is doing. The ST segment is very important to monitor on an EKG strip because if you are looking for something pathological, such as an MI, you might just find it here with ST segment elevation. This would mean the patient would be diagnosed as having a STEMI. We could continue this further, but we’ll save the pathological changes for another time.
So following the T wave, the heart is now ready to complete another beat! We have come full circle!
I hope you found this helpful, it is purely for basic understanding, EKG’s can be much more in depth! My best advice is so search YouTube for videos, as visualizing this is the best way to learn what it going on inside the heart!
Good Resources:
http://www.youtube.com/watch?v=7b98JcGIGyE
http://handwrittentutorials.com/
Rapid Interpretation of EKG’s 6th Ed. – Dale Durbin (really good book)


