Awesome website for practicing EKG interpretation!

Ok so I was needing to brush up on my EKG/ECG interpretation, simply because its not everyday we see complete heart block or Mobitz 2, therefore, I went on a quizzing rampage. I stumbled upon this site and it was a lifesaver, totally better than flipping through a book.

Check it out HERE!

EKG: Hypokalemia vs Hyperkalemia

So you should already know that potassium (K+) is VERY important in our bodies. From the action of K+ in the depolarization and repolarization which takes place in the heart, you can imagine that if there is too little, or too much potassium, then the effects will be present in the heart muscle.

HYPOkalemia

Hypo –  meaning; less, not enough, below normal levels. Therefore, here we are talking about not enough potassium. Below is an EKG, and from my last posting where you became familiar with a normal EKG, you should be able to notice there are things about this EKG that are abnormal (If you noticed that, then well done!)

You can see that the U wave is really big, or in medical terms; prominent U waves are present. The T wave on the other hand is said to be “inverted” or the opposite direction that it should be, it can be flattened also. So just looking at this portion we can see that the REpolarization phase is definitely going to be affected by these changes.

I like to think of hypokalemia as making everything more depressed. A depressed person, moves slower, things take longer for them to do, they are disorganized and one thing runs into another.

Other things that can be seen in Hypokalemia in the EKG: the ST segment can be depressed (below the flat baseline), the PR interval can be prolonged (longer that should be) as well as the QT interval (due to the merging of T and U waves) and the P wave can get taller and longer.

Hypokalemia is serious because it can develop into life threatening arrhythmia such as Torsades de Pointe, Ventricular Tachycardia, Ventricular Fibrillation.

HYPERkalemia

This is the opposite, HYPER: too much, more than baseline, overload. Too much is just as dangerous and not enough, and as you can see from the strip below, the EKG will show you signs of high K+.

P waves here in this strip is missing; you might see small to no P waves, coupled with spiked T waves. Look at the T waves here, they are as tall as the QRS complex! In severe hyperkalemia, the QRS complex can widen also.

So as with hypokalemia, I like to think use little story concepts to remember the differences. So I like to think of hyperkalemia as an ADHD child: the T waves are hyper and the P waves are playing hide-&-go-seek. Repolarization period here is affected by surplus potassium by causing a faster repolarization period, and reducing the response of sodium channels in the myocardium; therefore slowing conduction around the heart and reducing the P wave in the strip.

So how can we tell when someone is hyperkalemic? Think: Blood test (straight forward, check K+ level), ABG (metabolic acidosis), hx renal disease (reduces elimination of K+), Addison’s disease, severe burns (mass K+ being released for cells/cell-lysis?), Digoxin toxicity.

What to know about potassium:

Potassium is mostly found inside the cells.

The normal range for potassium is 3.5-5.0 mEq/L

Cardiac Tamponade

This has nothing to do with tampons in the heart ok! Just an FYI.

When blood or fluid accumulate in the sac which surrounds the heart it exerts pressure against the heart, making it harder for the heart to pump. As you can imagine, if the ventricles cannot fill fully or contract effectively then cardiac output decreases. Decrease cardiac output is not good news!

So how do you know if someone has this?

Well the symptoms are nothing unusual: chest pain, restlessness, quick shallow breathing, palpitations, pallor, tachycardia, weak peripheral pulses, pulsus paradoxical, distended neck veins, low BP… (do these all sound a little familiar? MI anyone?) Well causes of cardiac tamponade can be MI, Dissecting aortic aneurysm (thoracic), end-stage lung cancer, heart surgery, Pericarditis caused by bacterial or viral infections, or direct wounds to the heart.

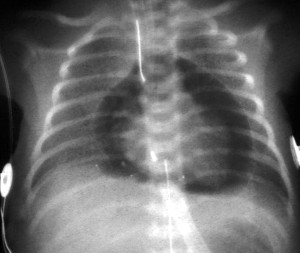
How do we diagnose? Echocardiogram is the usual diagnostic tool, but MRI, CT, CXR or EKG can also highlight or confirm this.

cardiac-tamponade-treatment-s48jtsnc

Can you see the halo of fluid around the heart?

This is an emergency! The fluid must be drained to reduce damage to the myocardium and reestablish cardiac output.

Pericardiocentesis is a procedure that uses a needle to remove fluid from the pericardial sac, the tissue that surrounds the heart. The patient will be hyperoxygenated, given fluids to maintain blood pressure. It is important to note that a pericardiocentesis may have to be repeated because cardiac tamponade can return. With fast treatment the outcome is usual good, without treatment death is immanent.

A pericardial draining tube may be placed during surgery to keep in place postop. The drainage will be measured every shift and documentation on the color, amount and consistency is very important! The tube will usually be removed slowly over the postop recovery weeks at the discretion of the cardiologist.

EKG Time: I never see U waves?

Have you been diligently looking through EKG strips on your Telemetry unit trying to find a u wave? But they taught you in school it was apart of the EKG complex right? Well yes, but they are not seen all the time, which isn’t a bad thing, in fact it doesn’t really matter that much. We don’t talk about U waves very often because there isn’t really much to say, there are usually other “cardinal signs”, where a U wave can confirm something we can already see. Could be classified as last phase of ventricular repolarization or endocardial repolarization, but at the end of the day, we don’t really understand it fully though there are some things you should know about U waves:

  • U waves follow T waves and should be about half the height of the T wave.
  • The U wave should be less than 2 mm (2 tiny boxes on the EKG strip).
  • They are mostly seen or more clearly seen, in sinus bradycardia, but if you can’t see them it’s ok!
  • Best seen in leads V2, V3
  • They can often interfere with the measurement of the QT intervals.

So you’ve found a EKG strip with some really cool U waves, you still need to know what the changes mean. The changes seen in U Waves (either prominent upright or depressed/inverted) are usually correlating to some other clearly visible change in the EKG (T waves changes, PR intervals or ST seg. changes). So what are some changes you should know about?

Inverted U waves are very myocardial focused. They usually mean trouble. Ischemic heart disease (often indicating left main or LAD disease) is one of a few serious readings that can come from a severely inverted U wave; Myocardial infarction (in leads with pathologic Q waves) and during a angina attack (acute ischemia or exercise-induced ischemia) they can also be present.

Upright waves (prominent ones that is) can mean Hypokalemia (remember the triad: ST segment depression, low amplitude T waves, and prominent U waves). There are times in pathological cases where the T and U wave can merge together to create a large wave, it makes it very tricky to know if it is a very large elevated T or a merge, look at the full picture, does this patient have a CNS disease or disease process going on? Then most likely it is a merge. Lastly, drugs. We all know that drugs interfere with all sorts of things, so what drugs could be messing with your U waves? Quinidine and other type 1A antiarrhythmics. Any drug that is acting on the heart can have adverse effects, but don’t forget to think about antipsychotics too! So keep this in mind when reading your EKG. Although you are focusing on a map of the heart, keep in mind that this is a patient, and every patient has a physiological story. The map you are looking at can tell you a snapshot of it’s current mapping system, but there are always other factors to consider.

EKG Time!

Image

EKG TIME! (For basic understanding)

Ok so for many the EKG is a weird and wonderful map of squiggles, but actually each little squiggle is very important in translating the conduction of the heart. From your A&P course you should know that the normal conduction of the heart starts in the SA node in the Right Atrium, it travels to the AV node in the wall of the right atrium (middle of the heart), then through the Bundle of His/Left & Right Bundle Branches and down through the Purkinje fibers. The EKG is basically a map of that scenario. Imagine that you are in a car in San Antonio (SA node), you need to drive to Aventura (AV node), then you go through the spaghetti junction (Bundle of His) while heading to Pittsburg (Purkinje fibers) – if you were to use Google maps, you would have the route highlighted out on the roads you have to take, right? Well that is basically what an EKG is! It is the highlighted route the conduction took through the heart.

I hope that has given you a little clarity on those squiggly lines, haha!

Now what does the map tell us?

As you can see we use letters to signify different areas of the squiggle. You can see that P is a little bump at the beginning. This is showing us that the atria of the heart are depolarizing (another fancy word for compress or pump). The atria is pushing the blood into the ventricles. P shows that the car has left the SA node in the Right Atrium and is traveling to the AV node in the middle of the heart. From P to Q (called PR complex),  the car then leaves the AV node and travels down through the Bundle of His. One the car travels out from the Bundle of His down the Bundle Branches, through the Purkinje fibers and the rest of the heart so a QRS complex occurs. The QRS shows that the ventricles have received all the blood from the atria and pumps it back out to lungs (right V) and aorta (left V). And with that you have just witnessed a heartbeat.

Well what about the leftover squiggles…

So between the S and the T (called the ST segment), we see the heart recovering from the heartbeat, otherwise known as Ventricular REpolarization. Think about clenching your fist really hard and then relaxing, that is in essence what the heart is doing. The ST segment is very important to monitor on an EKG strip because if you are looking for something pathological, such as an MI, you might just find it here with ST segment elevation. This would mean the patient would be diagnosed as having a STEMI. We could continue this further, but we’ll save the pathological changes for another time.

So following the T wave, the heart is now ready to complete another beat! We have come full circle!

I hope you found this helpful, it is purely for basic understanding, EKG’s can be much more in depth! My best advice is so search YouTube for videos, as visualizing this is the best way to learn what it going on inside the heart!

Good Resources:

http://www.youtube.com/watch?v=7b98JcGIGyE

http://handwrittentutorials.com/

Rapid Interpretation of EKG’s 6th Ed. – Dale Durbin (really good book)